Basic analyses VMD
Note
Please report bugs, errors or enhancement requests through Issue Tracker or if you have a question about SIRAH open a New Discussion.
This tutorial shows how to perform Root Mean Square Deviation (RMSD), Root Mean Square Fluctuation (RMSF), Radius of gyration (Rg), and Solvent-Accessible Surface Area (SASA) analyses on a SIRAH CG simulation trajectory file using VMD. The protein−DNA complex used here is the 3′ Repair Exonuclease 1 (TREX 1, PDB id: 5YWS) and its simulation was previously dicussed by Klein et al. (check the SIRAH Tools tutorial for additional analyses on this system). We strongly advise you to read the article before starting the tutorial.
Since VMD is a powerful molecular visualization software, you may find it convenient and familiar to perform trajectory analysis directly in VMD. In the following sections, we will concentrate on the practical side of these analyses in VMD and will not delve into the theory.
Warning
This tutorial requires the use of VMD and Xmgrace. Install these applications if you do not already have them. If you need to install these application, visit the following websites for installation instructions and additional information: VMD installation guide and Xmgrace installation guide.
Important
In this tutorial, we used VMD version 1.9.4. A few details may vary depending on the software version and operating system.
Loading the Trajectory
After processing the output trajectory to account for the Periodic Boundary Conditions (PBC) (see Amber, GROMACS or NAMD tutorials for examples of how you can do this), load the processed trajectory and the sirah_vmdtk.tcl file in VMD:
vmd ../5YWS_cg.psf 5YWS_cg_md_pbc.xtc -e ../sirah.ff/tools/sirah_vmdtk.tcl
Tip
You can also load sirah_vmdtk.tcl inside VMD. Go to Extensions > Tk Console and enter:
For AMBER
source ../sirah.amber/tools/sirah_vmdtk.tcl
For GROMACS
source ../sirah.ff/tools/sirah_vmdtk.tcl
Attention
The file sirah_vmdtk.tcl is a Tcl script that is part of SIRAH Tools and contains the macros to properly visualize the coarse-grained structures in VMD. These macros will facilite our atom selection within VMD. You can go to the SIRAH Tools tutorial to learn more about the macros.
That’s it! Now you can analyze the trajectory.
RMSD
The Root Mean Square Deviation (RMSD) is one of the most common analyses performed when analyzing a MD trajectory. Without delving into the theoretical aspects, it can be stated that the RMSD serves as a metric for assessing the degree of structural resemblance across different molecular conformations within a given system along a trajectory.
To perform this analysis you can take advantage of the RMSD Visualizer Tool, a built-in plugin in VMD designed to compute RMSD, or using a Tcl script.
Note
Similarly to the RMSD Visualizer Tool, the RMSD Trajectory Tool plugin is also available in VMD. However, their user interfaces vary, so the steps outlined here in this tutorial may not be applicable to the RMSD Trajectory Tool.
1.1 RMSD Visualizer Tool
Once your trajectory is loaded, go to Extensions > Analysis > RMSD Visualizer Tool. It will open the interface dedicated to RMSD analysis.
In the RMSD Visualizer Tool interface, select Top in the Molecule selection. To analyze the protein backbone, enter sirah_backbone and sirah_protein in the Atom selection box (see Figure 1A).
Tip
If you wish to focus on a specific bead, you can enter their name in the Atom selection box. For example, if you want something similar to a “carbon alpha” RMSD, you can type name GC.
Click on the ALIGN button.
This will superimpose each frame of the trajectory to the reference frame (in this case the first frame, frame 0) based on the selected groups of atoms to minimize RMSD. This step is not required but is recommended to display only the differences that arise from structure fluctuations and not from the displacements and rotations of the molecule as a whole.
Note
Since the VMD default Reference selection (Molecule ID: self and Frame: 0) was used, all the atoms of the selected molecule will be rotated and translated to fit the structure of the trajectory first frame (frame number 0). But you can modify this by setting a reference molecule. It is important to remember, when doing an alignment using another molecule as the reference, the selections for both molecules need to have the exact same number of atoms.
With all the necessary settings in place, click on the RMSD button. The tool will perform the analysis, computing the RMSD values for the selected region over the trajectory. After the calculation is complete, click on the Plot result button and a new window will open with a plot showcasing the computed RMSD versus frames (see Figure 1B).
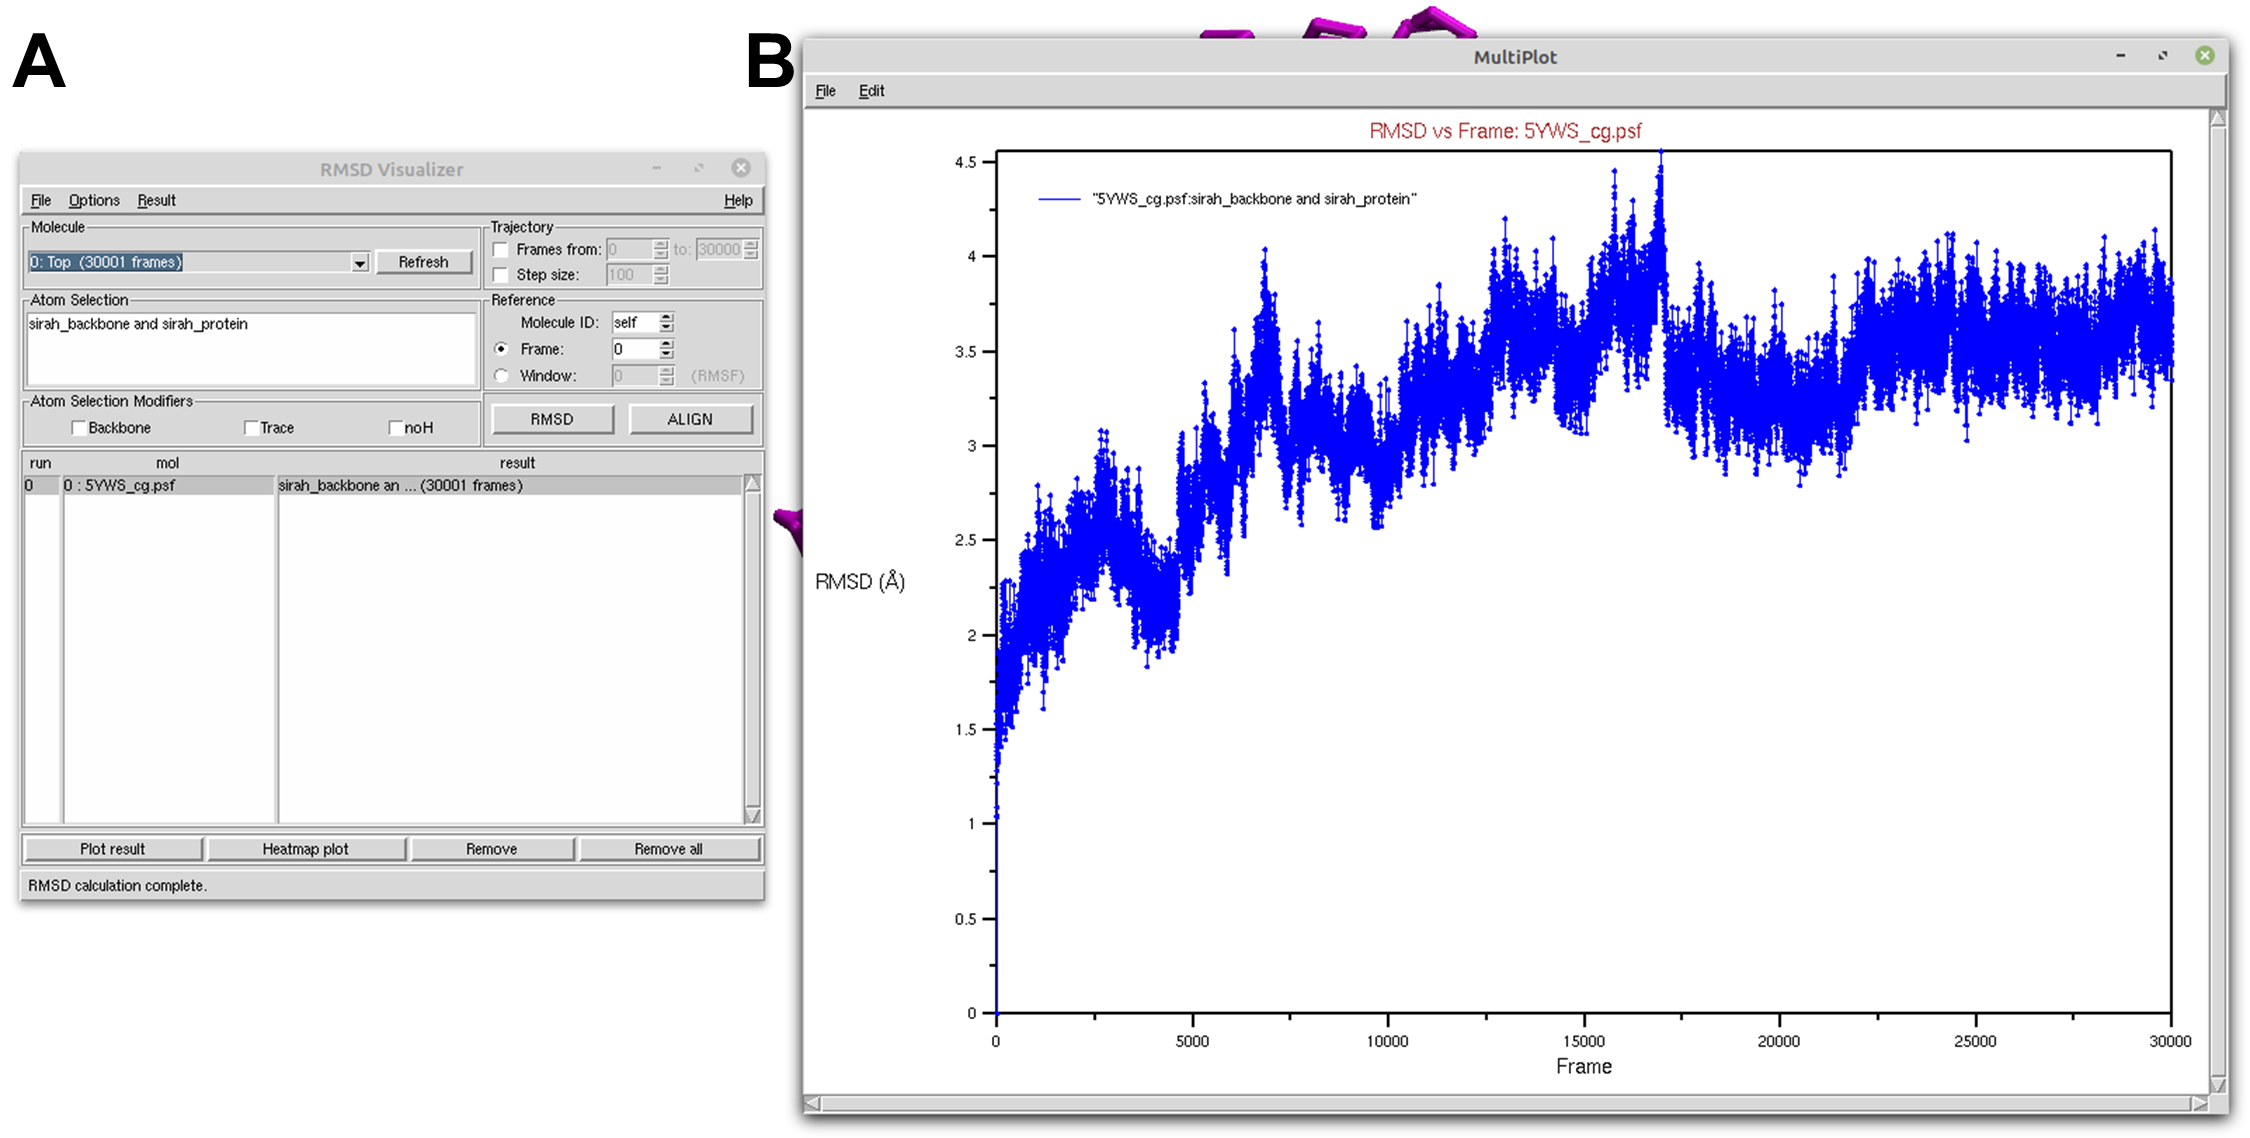
Figure 1. Protein RMSD of a SIRAH CG simulation using the RMSD Visualizer Tool of VMD. A) RMSD Visualizer Tool options used to perfom RMSD. B) The result RMSD vs Frame of the sirah_backbone and sirah_protein selection.
Tip
If your trajectory is too big, you can change the Step size parameter in the Trajectory section to skip frames. However, alignment does not accept a Step size.
Now, let’s calculate the RMSD for the DNA molecule. In the Atom selection box, type in sirah_backbone and sirah_nucleic. Then, click on the ALIGN button and then on the RMSD button. A new RMSD line will appear in the results box (see Figure 2A). Select it and click on the Plot result button to open the RMSD versus frame plot window (see Figure 2B).
Note
Before calculating RMSD, alignment must be performed if you wish to display only differences resulting from structure fluctuations for your new selection.
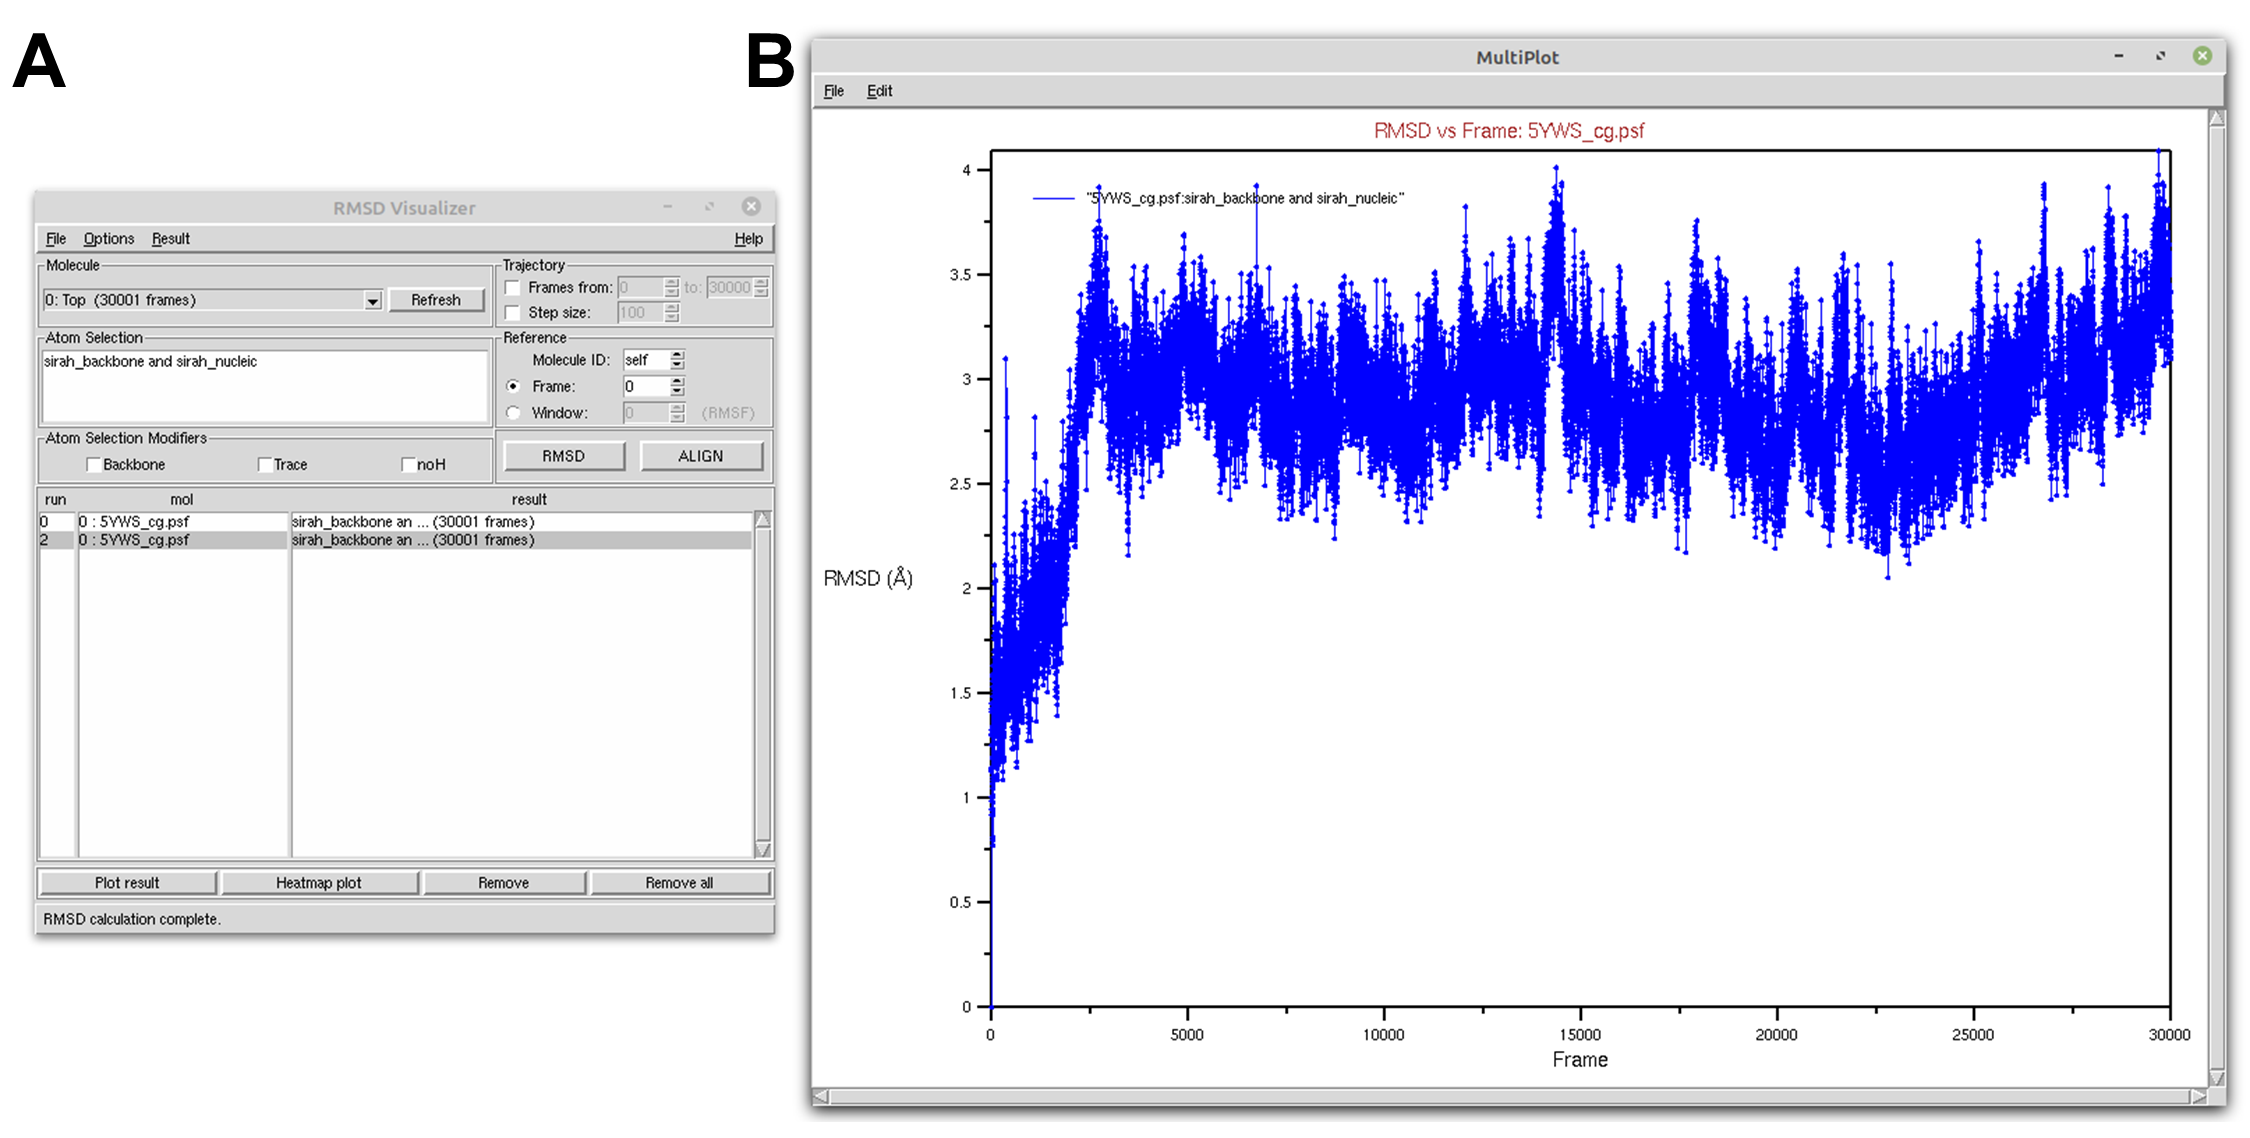
Figure 2. DNA RMSD of a SIRAH CG simulation using the RMSD Visualizer Tool of VMD. A) RMSD Visualizer Tool options used to perfom RMSD. B) The result RMSD vs Frame of the sirah_backbone and sirah_nucleic selection.
With the RMSD Visualizer Tool, you can also choose to plot the RMSD of both protein and DNA in the same window by selecting both calculations and clicking on the Plot result button (see Figure 3).
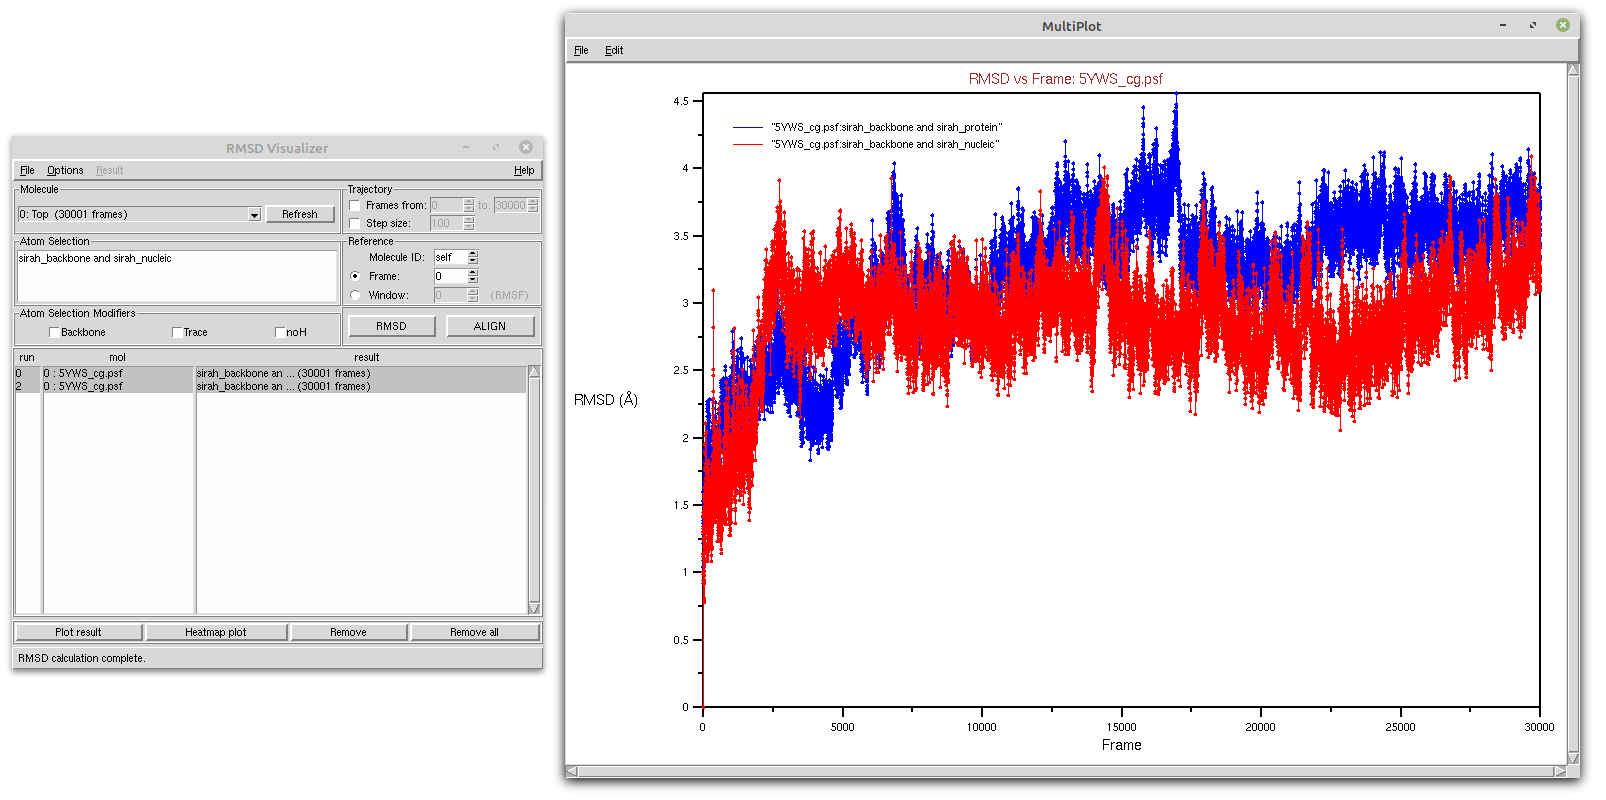
Figure 3. Protein (blue) and DNA (red) RMSD of a SIRAH CG simulation using the RMSD Visualizer Tool of VMD.
Tip
If you prefer to use external plotting programs, you can save the data in a text file (on the plot window go to File > Export to Xmgrace or File > Export to ASCII vectors) and then import the data into your preferred plotting software.
1.2. Tcl script
The same actions can be taken on the scripting level using the Tk Console. Thus, you can create a rmsd_protein.tcl file to calculate RMSD of the protein and output a text file rmsd_prot.dat:
#set output file name
set outfile [open rmsd_prot.dat w];

#set reference as the first frame using protein backbone as selection
set all [atomselect top all]
set reference [atomselect top "sirah_backbone and sirah_protein" frame 0]
#set trajectory selection also as the protein backbone
set compare [atomselect top "sirah_backbone and sirah_protein"]

#get the number of frames
set N [molinfo top get numframes]

#calculate RMSD for all frames
for {set i 0} {$i < $N} {incr i} {
   #get the correct frame
   $all frame $i
   #do the alignment
   set aling_m  [measure fit $compare $reference]
   $all move $aling_m
   #compute the RMSD
   set rmsd [measure rmsd $compare $reference]

   #print the RMSD in the output file
   puts $outfile "$i \t $rmsd"
}
close $outfile
With the rmsd_protein.tcl file in your work directory, go to Extensions > Tk Console and enter:
source rmsd_protein.tcl
You can use Xmgrace to plot the result:
xmgrace rmsd_prot.dat
You can create a rmsd_nucleic.tcl file by changing the following lines:
set outfile [open rmsd_prot.dat w]toset outfile [open rmsd_nucl.dat w];set reference [atomselect top "sirah_backbone and sirah_protein" frame 0]toset reference [atomselect top "sirah_backbone and sirah_nucleic" frame 0];set compare [atomselect top "sirah_backbone and sirah_protein"]toset compare [atomselect top "sirah_backbone and sirah_nucleic"].
You can use Xmgrace to plot the results:
xmgrace rmsd_prot.dat rmsd_nucl.dat
Tip
The files rmsd_prot.dat and rmsd_nucl.dat are compatible with external plotting programs.
RMSF
The Root Mean Square Fluctuation (RMSF) of a structure is the time average of the RMSD per residue. In contrast to the RMSD, which quantifies how much a structure deviates from a reference over time, the RMSF can disclose which system components are the most mobile. To perform this analysis, you will use a Tcl script directly within the Tk Console.
Thus, you can create a rmsf_protein.tcl file to calculate RMSF of the protein and output a text file rmsf_prot.dat:
#set output file name
set outfile [open rmsf_prot.dat w];

#set reference and selection of protein
set all [atomselect top all]
set reference [atomselect top "sirah_protein and name GC" frame 0]
set sel [atomselect top "sirah_protein and name GC"]

#get the number of frames
set N [molinfo top get numframes]

#do the alignment
for {set i 0} {$i < $N} {incr i} {
   #get the correct frame
   $all frame $i
   #do the alignment
   set align_m [measure fit $sel $reference]
   $all move $align_m
}

#calculate rmsf for all trajectory frames
set rmsf [measure rmsf $sel first 0 last -1 step 1]

#print to file the rmsf by residue
for {set i 0} {$i < [$sel num]} {incr i} {
   puts $outfile "[expr {$i+1}] [lindex $rmsf $i]"
}
close $outfile
Tip
If your trajectory is too big, you can change the step parameter in the set rmsf [measure rmsf $sel first 0 last -1 step 1] line to skip frames. You can also change first and last parameters if you have a frame range.
With the rmsf_protein.tcl file in your work directory, go to Extensions > Tk Console and enter:
source rmsf_protein.tcl
You can plot the result using Xmgrace, and a plot similar to Figure 4 will appear:
xmgrace rmsf_prot.dat
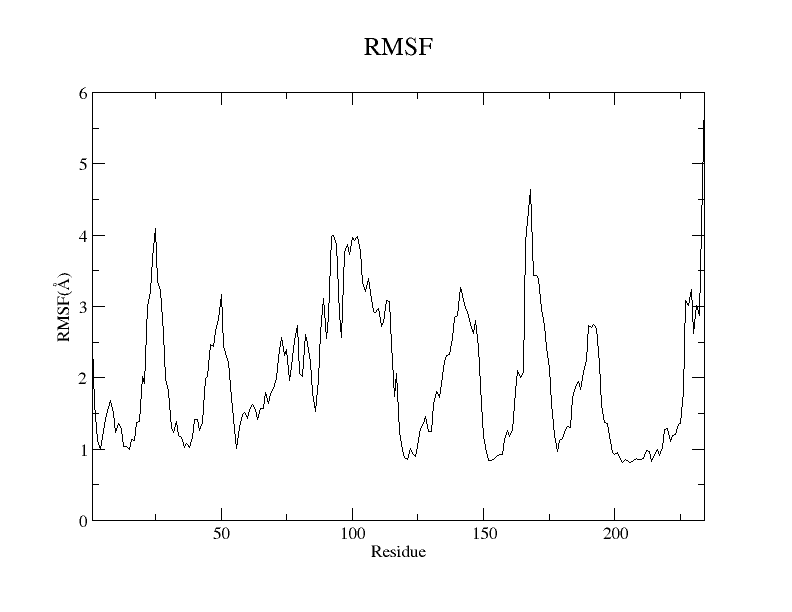
Figure 4. RMSF plot of the GC beads of the protein residues from the SIRAH CG simulation using the Xmgrace program.
For the DNA, you can create a rmsf_nucleic.tcl file to calculate the RMSF per strand:
#set output file name
set outfile_strand1 [open rmsf_DNA_strand1_tcl.dat w];
set outfile_strand2 [open rmsf_DNA_strand2_tcl.dat w];

#set reference and selection the DNA
set all [atomselect top all]
set reference [atomselect top "residue 234 to 253 and name C5X" frame 0]
set sel [atomselect top "residue 234 to 253 and name C5X"]

#get the number of frames
set N [molinfo top get numframes]

#do the alignment
for {set i 0} {$i < $N} {incr i} {
   # get the correct frame
   $all frame $i
   #do the alignment
   set align_m [measure fit $sel $reference]
   $all move $align_m
}

set strand1 [atomselect top "residue 234 to 243 and name C5X"]
set strand2 [atomselect top "residue 244 to 253 and name C5X"]

#calculate rmsf for all trajectory frames
set rmsf_strand1 [measure rmsf $strand1 first 0 last -1 step 1]
set rmsf_strand2 [measure rmsf $strand2 first 0 last -1 step 1]

#print to file the rmsf for strand 1
for {set i 0} {$i < [$strand1 num]} {incr i} {
   puts $outfile_strand1 "[expr {$i+1}] [lindex $rmsf_strand1 $i]"
}
close $outfile_strand1

#print to file the rmsf for strand 2
for {set i 0} {$i < [$strand2 num]} {incr i} {
   puts $outfile_strand2 "[expr {$i+1}] [lindex $rmsf_strand2 $i]"
}
close $outfile_strand2
With the rmsf_nucleic.tcl file in your work directory, go to Extensions > Tk Console and enter:
source rmsf_nucleic.tcl
Two files will be created rmsf_nucl_strand1.dat and rmsf_nucl_strand2.dat. You can plot them using Xmgrace, and a plot similar to Figure 5 will appear:
xmgrace rmsf_nucl_strand1.dat rmsf_nucl_strand2.dat
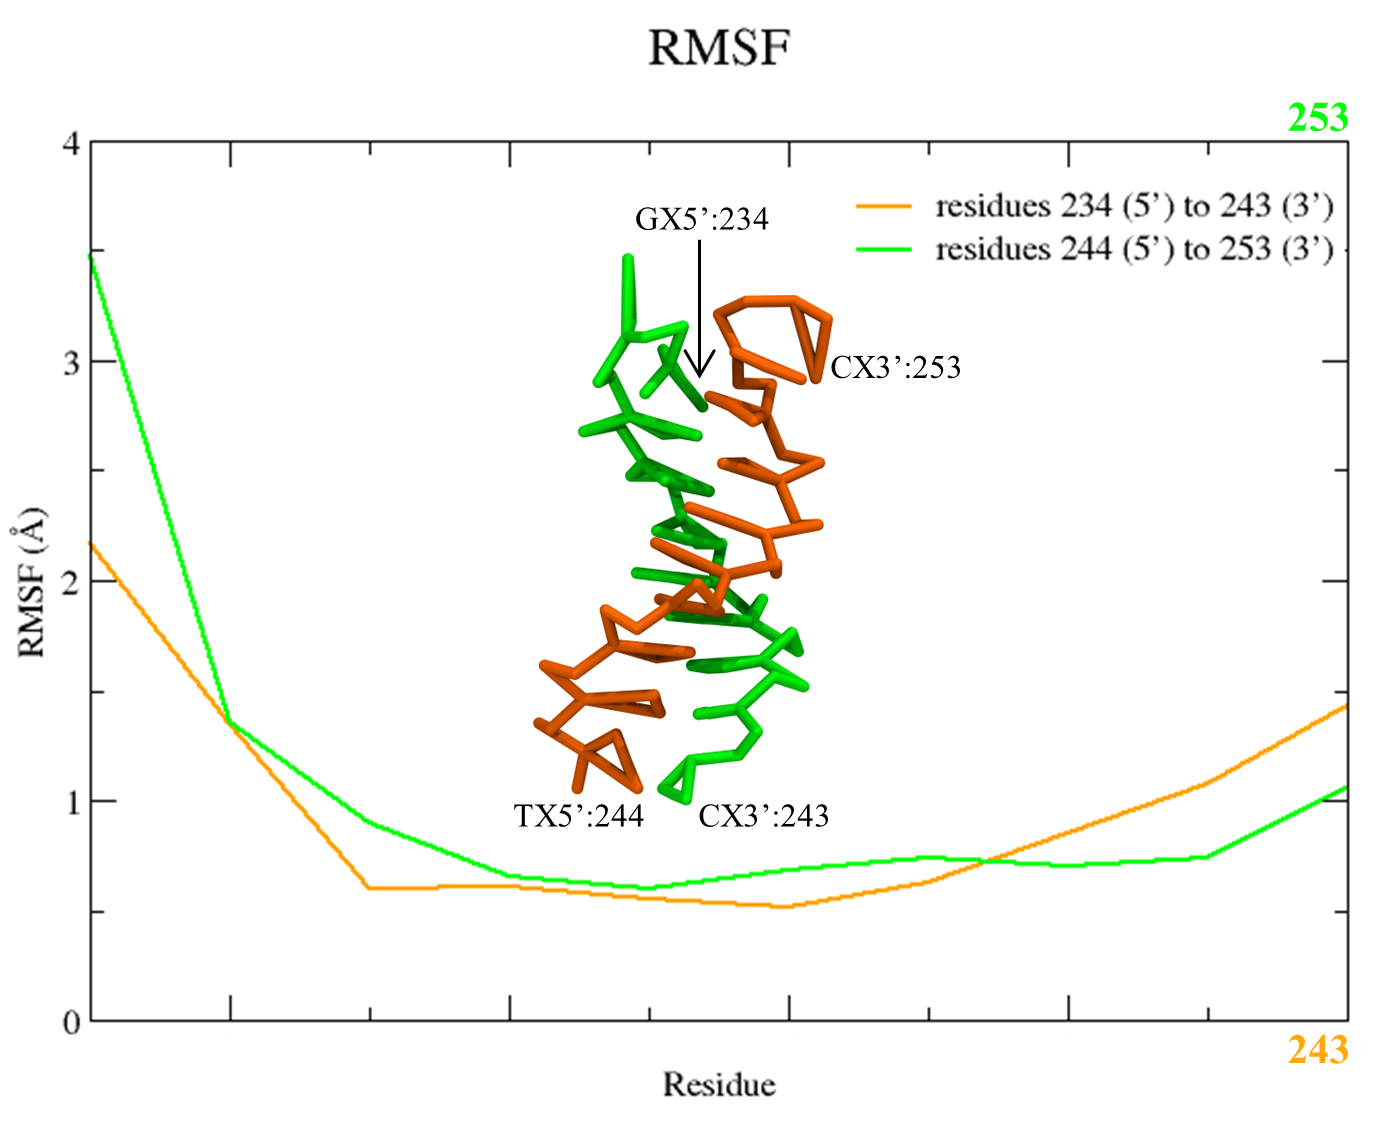
Figure 5. RMSF plot of the C5X beads of the two DNA stands from the SIRAH CG simulation using the Xmgrace program.
Note
The name GC and name C5X would be the bead selection similar to a “carbon alpha” for protein and DNA, respectively.
Tip
The files rmsf_prot.dat, rmsf_nucl_strand1.dat, and rmsf_nucl_strand2.dat are compatible with external plotting programs.
Radius of gyration
The Radius of gyration (Rg) is a metric that quantifies the spatial extent of a protein by measuring the distance between its center of mass and its termini. The metric offers an indicator of the degree of compactness in the protein structure. To perform this analysis, you will use a Tcl script directly within the Tk Console.
Thus, you can create a rgyr.tcl file to calculate Rg of the protein and output a text file rgyr_protein.dat:
#set output file name
set output [open "rgyr_protein.dat" w]

#set protein selection
set sel [atomselect top "sirah_protein"]

#get the number of frames
set n [molinfo top get numframes]

#rgyr calculation loop
for {set i 0} {$i < $n} {incr i} {
   #get the correct frame
   molinfo top set frame $i
   #calculate radius of gyration for the frame
   set rgyr [measure rgyr $sel]
   puts "\t \t progress: $i/$n"
   #print to file the rgyr
   puts $output "$rgyr"
}
puts "\t \t progress: $n/$n"
puts "Done."
close $output
With the rgyr.tcl file in your work directory, go to Extensions > Tk Console and enter:
source rgyr.tcl
You can plot the result using Xmgrace, and a plot similar to Figure 6 will appear:
xmgrace rgyr_protein.dat
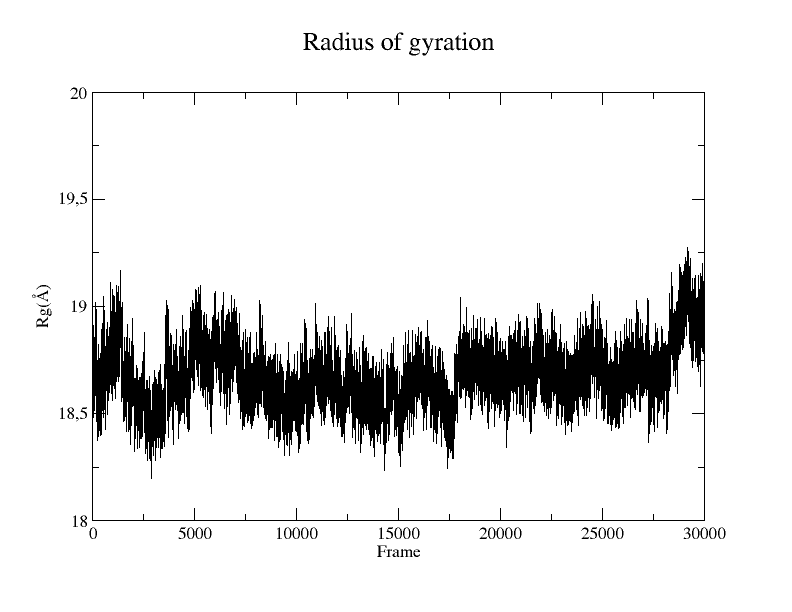
Figure 6. Rg plot of the protein from the SIRAH CG simulation using the Xmgrace program.
Tip
The file rgyr_protein.dat is compatible with external plotting programs.
SASA
The Solvent-Accessible Surface Area (SASA) refers to the measurement of the surface area of a biomolecular structure that can be reached by solvent molecules. The SASA can be defined as the range to which the atoms on the surface of a protein form contacts with the solvent. Although there are a number of algorithms and computational tools available for estimating the SASA, you can conduct the estimation using a simple Tcl script within the Tk Console.
Thus, you can create a sasa.tcl file to calculate SASA of your protein and output a text file SASA_protein_nobackbone.dat:
#set output file name
set output [open "SASA_protein_nobackbone.dat" w]

#select only solvent-accessible points that are not the backbone
set sel [atomselect top "not name GN GC GO"]
#select the protein
set protein [atomselect top "sirah_protein"]

#get the number of frames
set n [molinfo top get numframes]

#sasa calculation loop
for {set i 0} {$i < $n} {incr i} {
   #get the correct frame
   molinfo top set frame $i
   #calculate sasa assigning a sphere radius of 2.1 to not backbone atoms
   set sasa [measure sasa 2.1 $protein -restrict $sel]
   #print to screen frame/total number of frames
   puts "\t \t progress: $i/$n"
   #print to file the sasa
   puts $output "$sasa"
}
puts "\t \t progress: $n/$n"
puts "Done."
close $output
Note
The probe radius is set at 2.1 Å as it corresponds to the radius of a WT4 bead.
Tip
You can restrict your selection to a particular residue or region by modifying the set sel [atomselect top "not name GN GC GO"] line.
With the sasa.tcl file in your work directory, go to Extensions > Tk Console and enter:
source sasa.tcl
You can plot the result using Xmgrace, and a plot similar to Figure 7 will appear:
xmgrace SASA_protein_nobackbone.dat
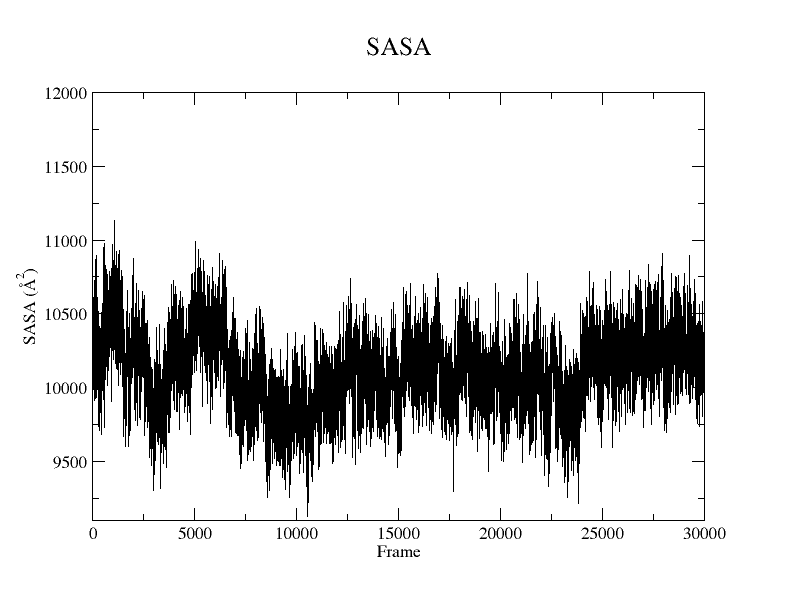
Figure 7. SASA plot of the protein without the backbone atoms from the SIRAH CG simulation using the Xmgrace program.
Tip
The files SASA_protein_nobackbone.dat is compatible with external plotting programs.
VMD in text mode
If you need to perform non-interactive analysis on large trajectories or if a graphical user interface is not available, you can also execute the scripts described here using VMD text mode. When in text mode, VMD does not provide a window for graphical output, but many of its features are available. To launch VMD in text mode, the -dispdev text and -f flags are appended to the command line used before to load the trajectory, as shown below:
vmd -dispdev text -f ../5YWS_cg.psf 5YWS_cg_md_pbc.xtc -e ../sirah.ff/tools/sirah_vmdtk.tcl
The output will be similar to the following:
Info) VMD for LINUXAMD64, version 1.9.3 (November 30, 2016)
Info) http://www.ks.uiuc.edu/Research/vmd/
Info) Email questions and bug reports to vmd@ks.uiuc.edu
Info) Please include this reference in published work using VMD:
Info)    Humphrey, W., Dalke, A. and Schulten, K., `VMD - Visual
Info)    Molecular Dynamics', J. Molec. Graphics 1996, 14.1, 33-38.
Info) -------------------------------------------------------------
Info) Multithreading available, 12 CPUs detected.
Info)   CPU features: SSE2 AVX AVX2 FMA
Info) Free system memory: 58GB (93%)
Info) File loading in progress, please wait.
Info) Using plugin psf for structure file 5YWS_cg.psf
psfplugin) WARNING: no impropers defined in PSF file.
psfplugin) no cross-terms defined in PSF file.
Info) Analyzing structure ...
Info)    Atoms: 7270
Info)    Bonds: 10237
Info)    Angles: 4791  Dihedrals: 3727  Impropers: 0  Cross-terms: 0
Info)    Bondtypes: 0  Angletypes: 0  Dihedraltypes: 0  Impropertypes: 0
Info)    Residues: 1843
Info)    Waters: 0
Info)    Segments: 4
Info)    Fragments: 1592   Protein: 0   Nucleic: 0
Info) Using plugin xtc for coordinates from file 5YWS_cg_md_pbc.xtc
Info) Coordinate I/O rate 1564.4 frames/sec, 129 MB/sec, 19.2 sec
Info) Finished with coordinate file 5YWS_cg_md1_pbc.xtc.
SIRAH radii were set
SIRAH selection macros were set
SIRAH coloring mothods were set
SIRAH Tool kit for VMD was loaded. Use sirah_help to access the User Manual pages
vmd >
Attention
The file sirah_vmdtk.tcl is a Tcl script that is part of SIRAH Tools and contains the macros to properly visualize the coarse-grained structures in VMD. These macros will facilite our atom selection within VMD. You can go to the SIRAH Tools tutorial to learn more about the macros.
Thus, in the vmd > prompt, you can import any of the previously displayed Tcl scripts, for instance:
vmd > source rmsd_protein.tcl
Additionally, you can customize the Tcl scripts to include VMD commands to load and process your trajectories in conjunction with launching SIRAH Tools in VMD text mode. For example, you can create a rmsd_protein_dispdev.tcl file:
#Load parameter file
mol new 5YWS_cg.psf
#Load trajectory file
mol addfile 5YWS_cg_md_pbc.xtc waitfor all
#Load SIRAH tools
source sirah.ff/tools/sirah_vmdtk.tcl

#set output file name
set outfile [open rmsd_prot.dat w];

#set reference as the first frame using protein backbone as selection
set reference [atomselect top "sirah_backbone and sirah_protein" frame 0]
#set trajectory selection also as the protein backbone
set compare [atomselect top "sirah_backbone and sirah_protein"]

#get the number of frames
set N [molinfo top get numframes]

#calculate RMSD for all frames
for {set i 0} {$i < $N} {incr i} {
   #get the correct frame
   $compare frame $i
   #do the alignment
   $compare move [measure fit $compare $reference]
   #compute the RMSD
   set rmsd [measure rmsd $compare $reference]

   #print the RMSD in the output file
   puts $outfile "$i \t $rmsd"
}
close $outfile
quit
This script will load the topology 5YWS_cg.psf, the trajectory 5YWS_cg_md_pbc.xtc, and sirah_vmdtk.tcl files. Then, align the protein according to the first frame of the trajectory, calculate the RMSD, and create an output file with the name rmsd_prot.dat. With the quit command, VMD is closed. To read the script, you type:
vmd -dispdev text -e rmsd_protein_dispdev.tcl
Important
You can create multiple selections for RMSD, RMSF, Rg, or SASA within a single Tcl script to perform all analyses and output multiple result files.